

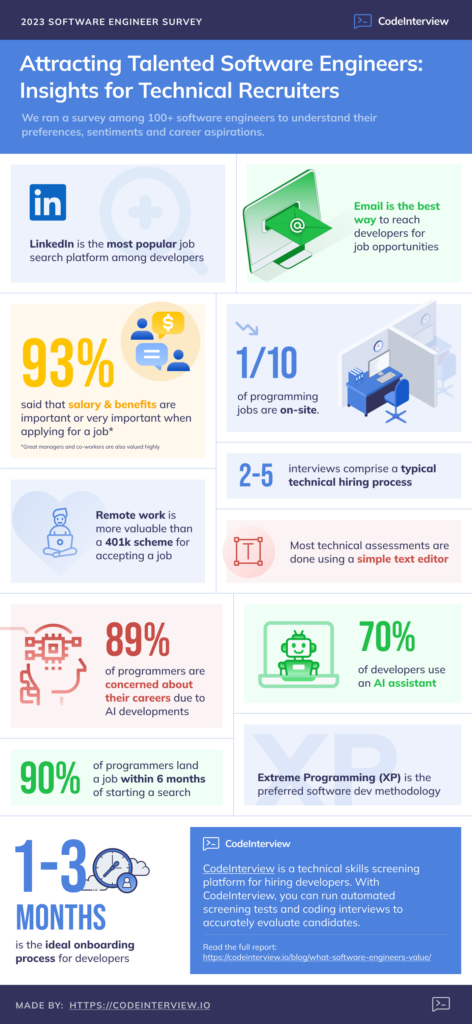
We ran a survey among 100+ software engineers to understand their preferences, sentiments and career aspirations. Specifically, we asked questions about how they look for jobs, what they value in an employer, the different hiring processes they have seen and their onboarding experience. The results can be helpful to both technical recruiters and engineering leaders that want to streamline their own hiring journey. And improve their employer brand as it relates to hiring experienced software developers.
Highlights:
- LinkedIn is the most popular job search platform among developers
- Email is the best way to reach developers for job opportunities
- Most technical assessments are done using a simple text editor
- A typical technical hiring process has 2-5 interviews
- Remote work is more valuable than a 401k scheme for accepting a job
- Almost 90% of programmers land a job within 6 months of starting a search
- The ideal onboarding process for developers takes 1-3 months
- Programmers are motivated by money, great managers and co-workers
- Extreme Programming (XP) is the most preferred software development methodology
- Only 10.4% of programming jobs are on-site
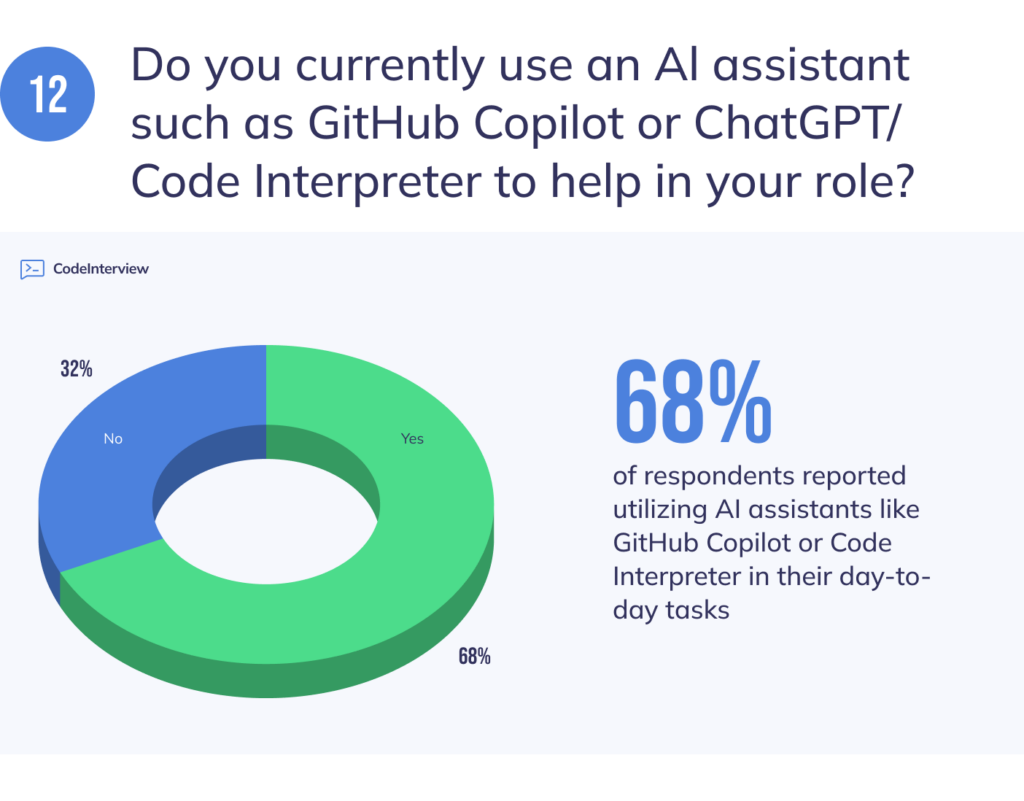
- Almost 70% of developers use an AI assistant like GitHub Copilot
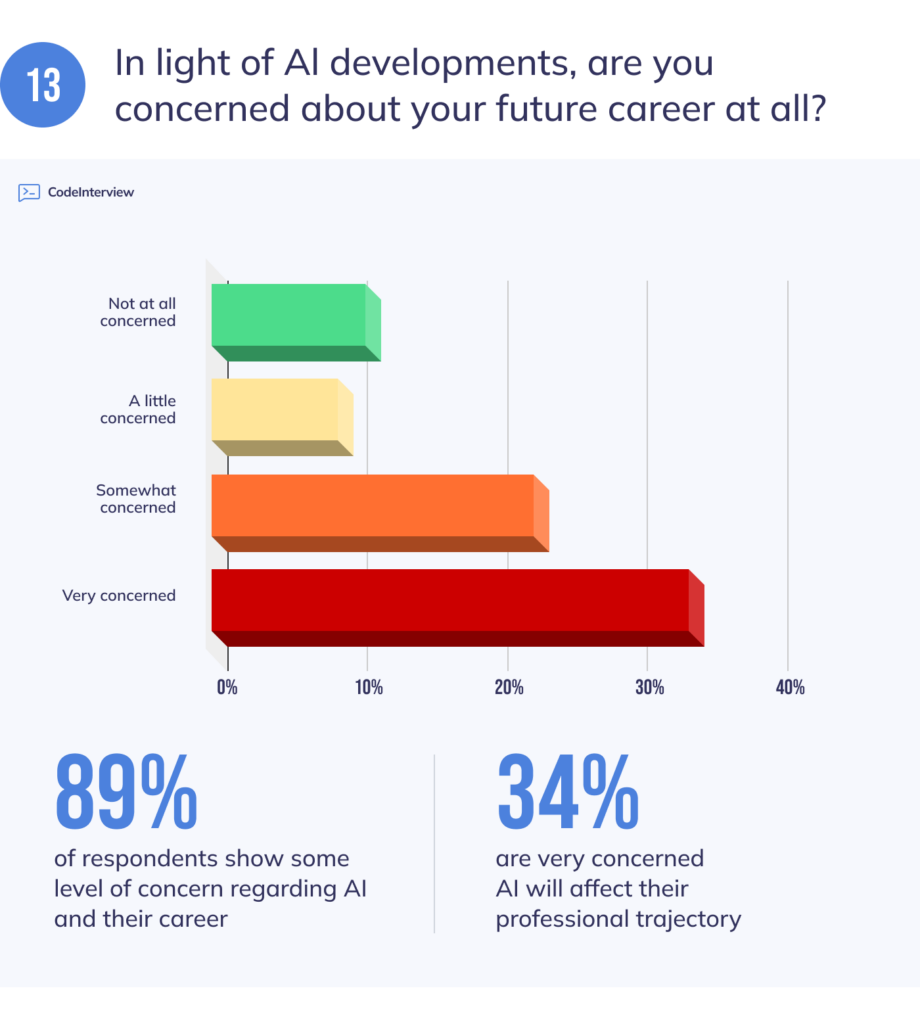
- 89% of programmers are concerned about their careers due to AI developments
Without further ado, here’s a summary of the survey results:
Share this Image On Your Site
<p><strong>Please include attribution to https://codeinterview.io/ with this graphic.</strong><br /><br /><a href='https://codeinterview.io/blog/what-software-engineers-value/'><img src='https://codeinterview.io/blog/wp-content/uploads/2023/06/Frame-35-944x2048.png' alt='Programming job stats infographic' width='1400' /></a></p>LinkedIn is the most popular job search platform among software developers
In the current job market, understanding the platforms that software engineers utilize for their job search is crucial for technical recruiters looking to optimize their sourcing strategies. According to our survey results, LinkedIn emerges as the dominant platform, with 70% marketshare. This finding highlights the importance of leveraging LinkedIn’s vast network of professionals and industry-specific groups to connect with and attract top software engineering talent.
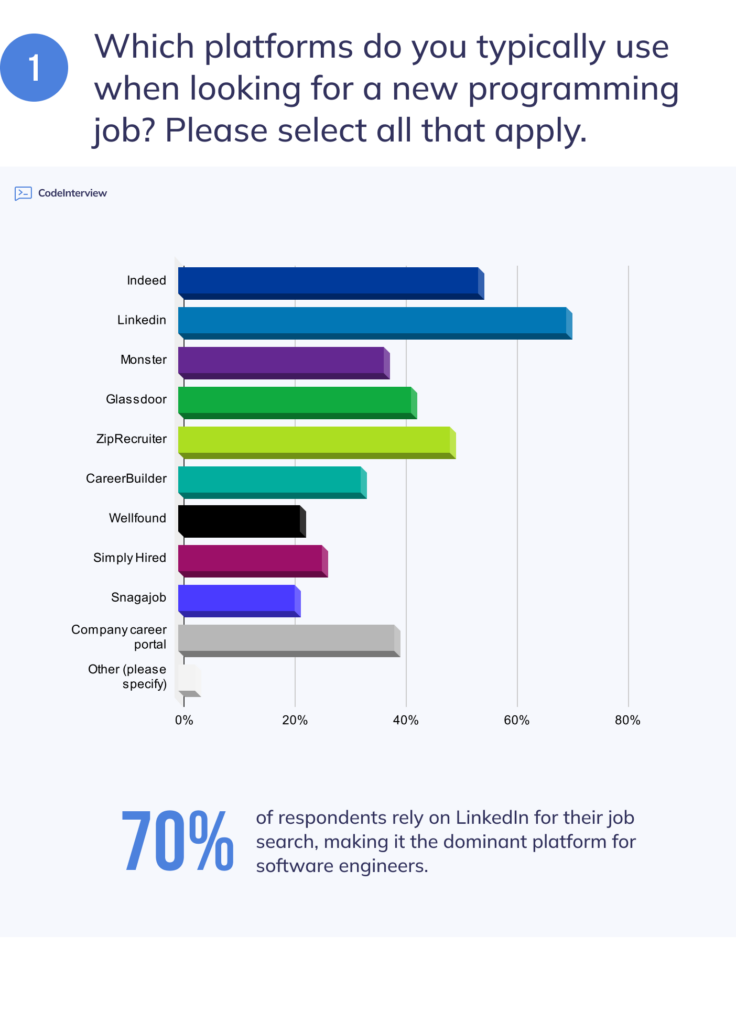
While LinkedIn remains the go-to platform for software engineers, it’s essential for recruiters to explore other platforms that have traction. One such platform is Indeed, which ranks second with 54% marketshare. As a job board with a wide range of industries and positions, Indeed offers a valuable opportunity for recruiters to reach a diverse pool of software engineers.
Intriguingly, our survey reveals that ZipRecruiter has surpassed traditional players like Monster.com and Glassdoor among software engineers. With ZipRecruiter now emerging as a prominent platform, technical recruiters should consider integrating it into their recruitment strategy. By utilizing ZipRecruiter, recruiters can tap into a growing user base and leverage its features. Such as targeted job alerts and candidate matching algorithms, to identify and engage with software engineering talent more effectively.
Your existing employees are the most trustworthy source of information about you as an employer
When it comes to researching potential employers, software engineers place a high level of trust in conversations with existing employees, according to our survey results. An impressive 80% of our respondents identified these conversations as a trustworthy source of information. This finding emphasizes the significance of building strong relationships with current employees and leveraging their experiences to attract top talent.
In addition to conversations with employees, Glassdoor reviews and interactions with recruiters or hiring managers are also considered highly trustworthy sources of information. It’s worth noting that recruiters and hiring managers are often employees themselves, which further reinforces the importance of fostering a positive work environment. By cultivating a culture that values transparency, collaboration, and employee satisfaction, organizations can create a reliable pipeline of talented candidates.
On the other hand, our survey highlights that Wikipedia pages and general press information are viewed as the least trustworthy sources of information when researching potential employers. Technical recruiters should be aware that candidates tend to place less trust in these sources and, therefore, should focus their efforts on providing authentic and reliable information through other channels.
Salary & benefits are most important to developers
Over 93% of respondents said that Salary & benefits are important or very important when applying for a programming role. Additionally, 89% value a healthy work-life balance and 88% look for a good team. Job security also comes in high with almost 87% of respondents finding it as important or very important.
On the other hand, having a prestigious employer is least important when measured against our other criteria.
The best way to reach developers is by email
Understanding the preferred communication channels of software engineers is vital for technical recruiters to effectively engage with potential candidates. Our survey results indicate that 38% of respondents expressed a preference for being contacted via email when it comes to job opportunities. This finding underscores the importance of utilizing email as a primary communication channel in recruitment efforts.
Coding assessments are now the standard
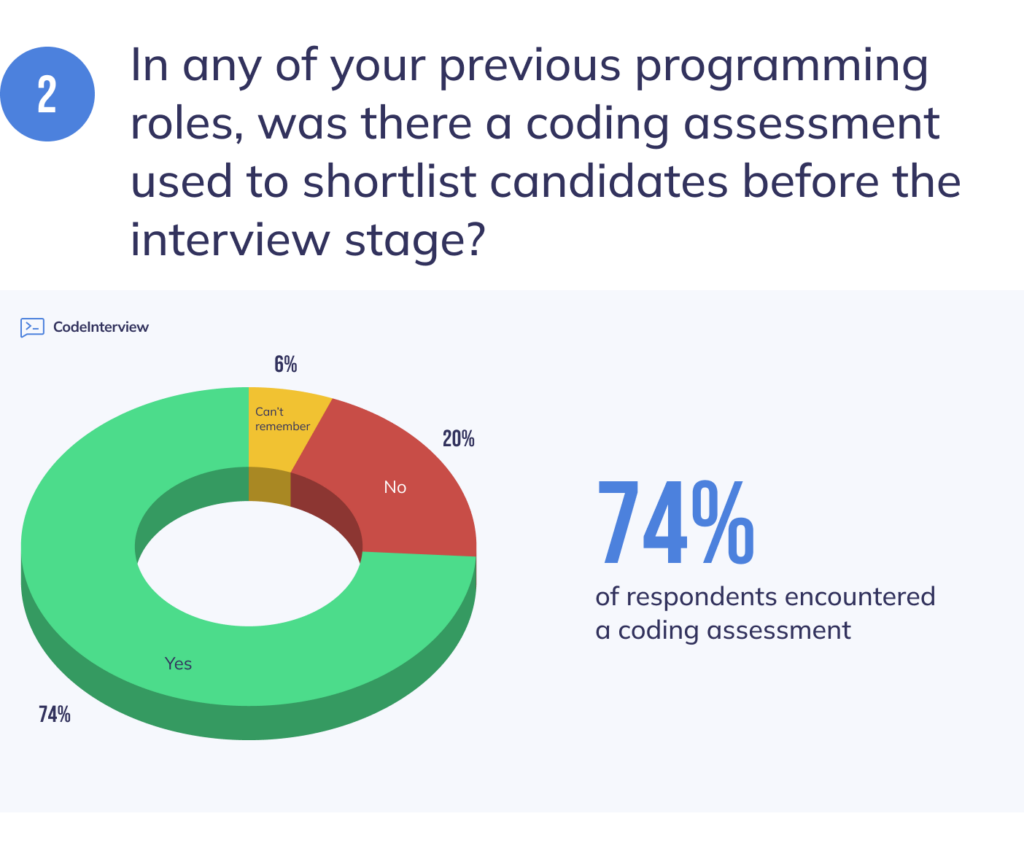
The prevalence of coding assessments and interviews in the job search process for software engineers highlights their significance as integral components of the technical recruiting process. Our survey results indicate that 74% of respondents encountered coding assessments as part of their job search, affirming their widespread usage as a means to evaluate candidates’ technical skills. Additionally, coding interviews were present in 70% of cases, indicating that a combination of coding assessments and interviews is commonly employed by organizations.
Text editors are the most popular way to conduct technical assessments
The widespread usage of text editors, such as Google Docs, for briefing candidates and conducting technical assessments highlights their importance as a preferred tool in the technical recruiting process. Our survey results reveal that more than half of the respondents (specifically, over 50%) utilized text editors like Google Docs during their application process, despite the absence of a dedicated integrated development environment (IDE).
Coding assessments and take-home projects are seen as good predictors of on-the-job performance
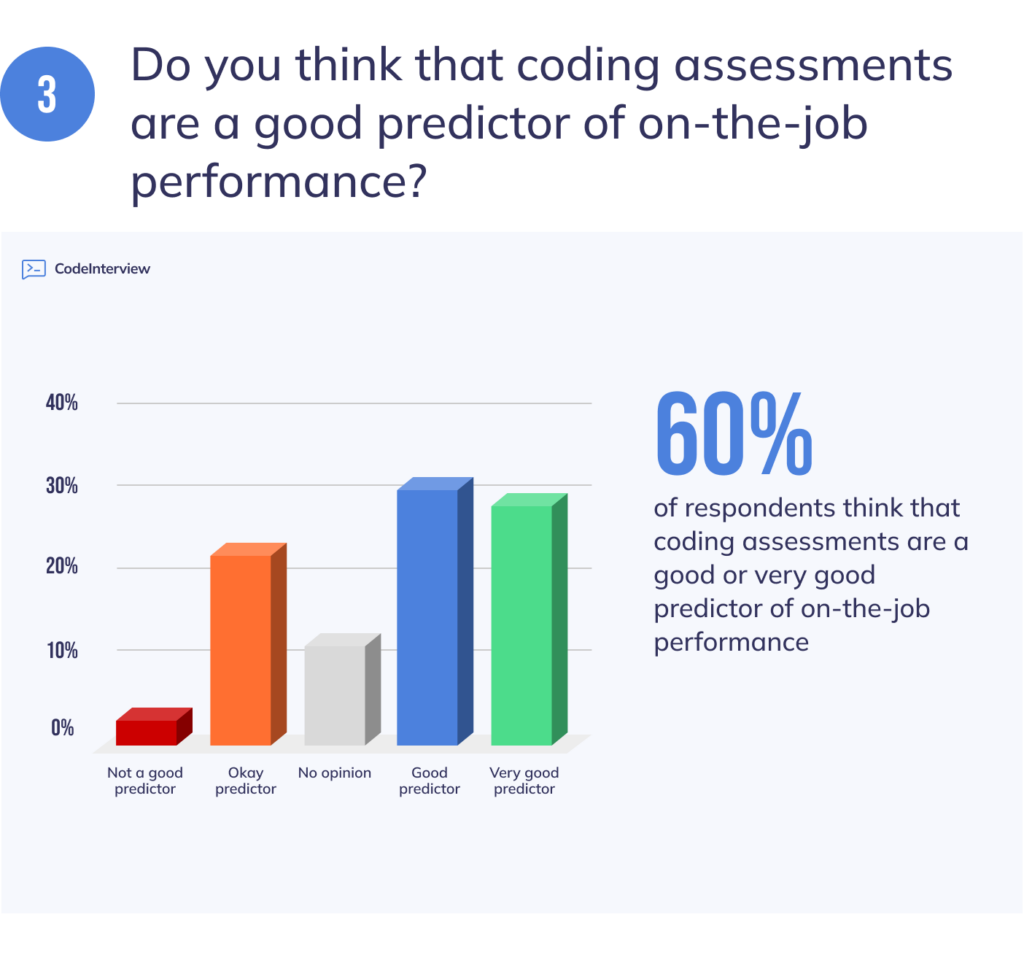
The belief among 60% of respondents that coding assessments are a good or very good predictor of on-the-job performance, along with 61% expressing a similar sentiment for take-home projects, underscores the value of these evaluation methods in assessing the capabilities of software engineering candidates. Technical recruiters can leverage this insight to enhance their assessment strategies and make more informed hiring decisions.
Coding assessments can help reduce hiring bias
The belief held by 66% of respondents that coding assessments reduce hiring bias in terms of conscious or unconscious preferences based on background, race, or religion underscores the potential of these evaluation methods to promote fairness and equal opportunities in the technical recruiting process. This insight is valuable for technical recruiters who strive to create an inclusive and unbiased hiring environment.
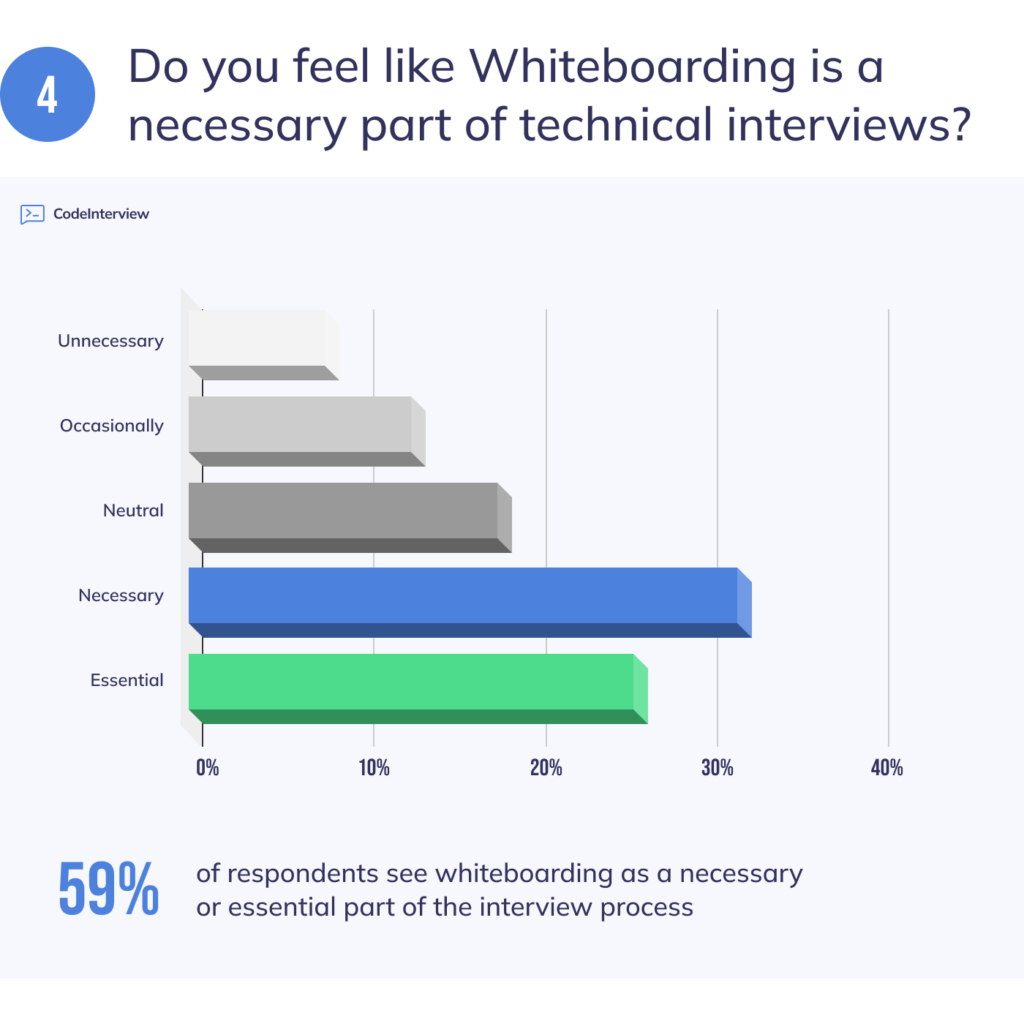
Whiteboarding is here to stay
The fact that over 70% of respondents have been evaluated using a whiteboard, either online or on-site, indicates the widespread use of this assessment method in technical interviews. Furthermore, 59% of respondents viewing whiteboarding as a necessary or essential part of the interview process highlights its perceived importance. As a recruiter, understanding the value and implications of whiteboarding can help optimize the assessment process.
Interview questions are typically at a good level
66% of respondents say that the interview questions at technical interviews are mostly relevant. This is in line with another question we had – 59% of respondents believe that technical interviewers have the necessary background knowledge to evaluate their skills during an interview.
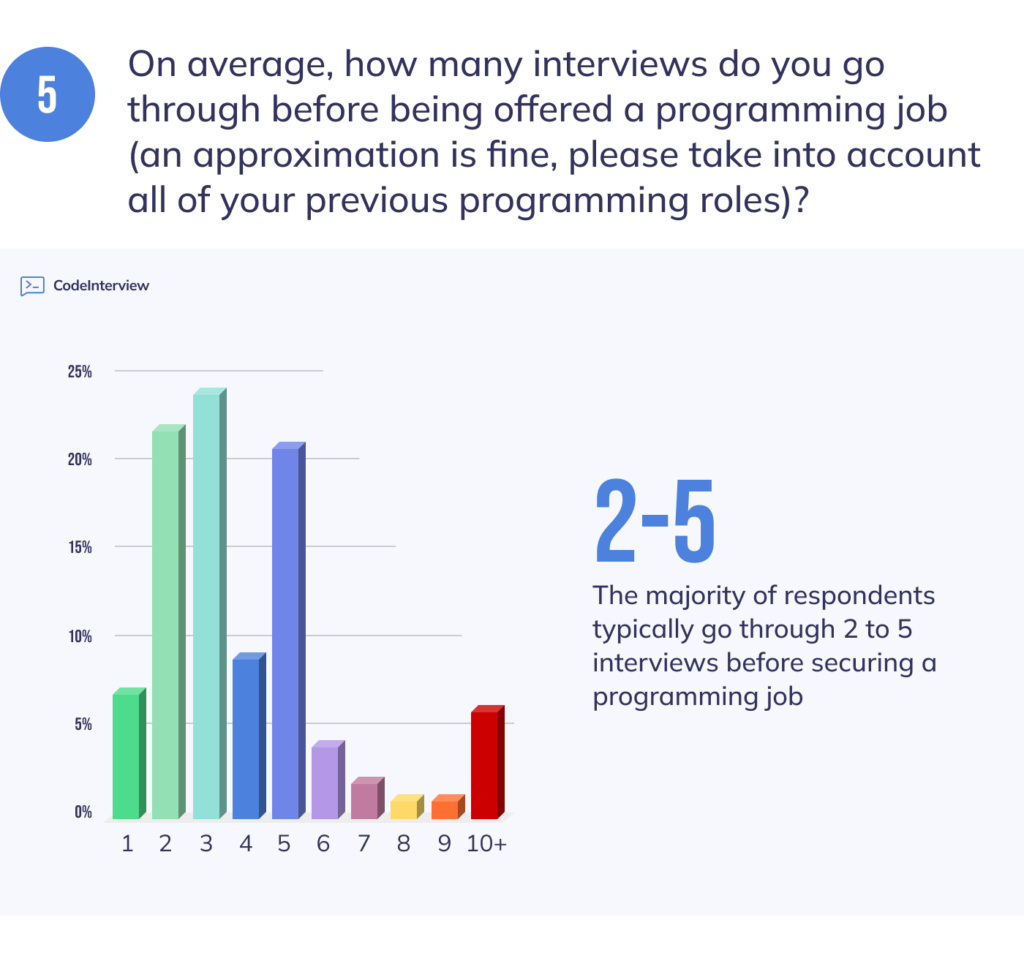
A typical hiring process has 2-5 interviews
The finding that 77% of respondents typically go through 2 to 5 interviews before securing a programming job provides valuable insights for technical recruiters. Understanding the number of interviews candidates typically undergo can help recruiters optimize their hiring processes, manage resources effectively, and make informed decisions regarding candidate evaluation and selection.
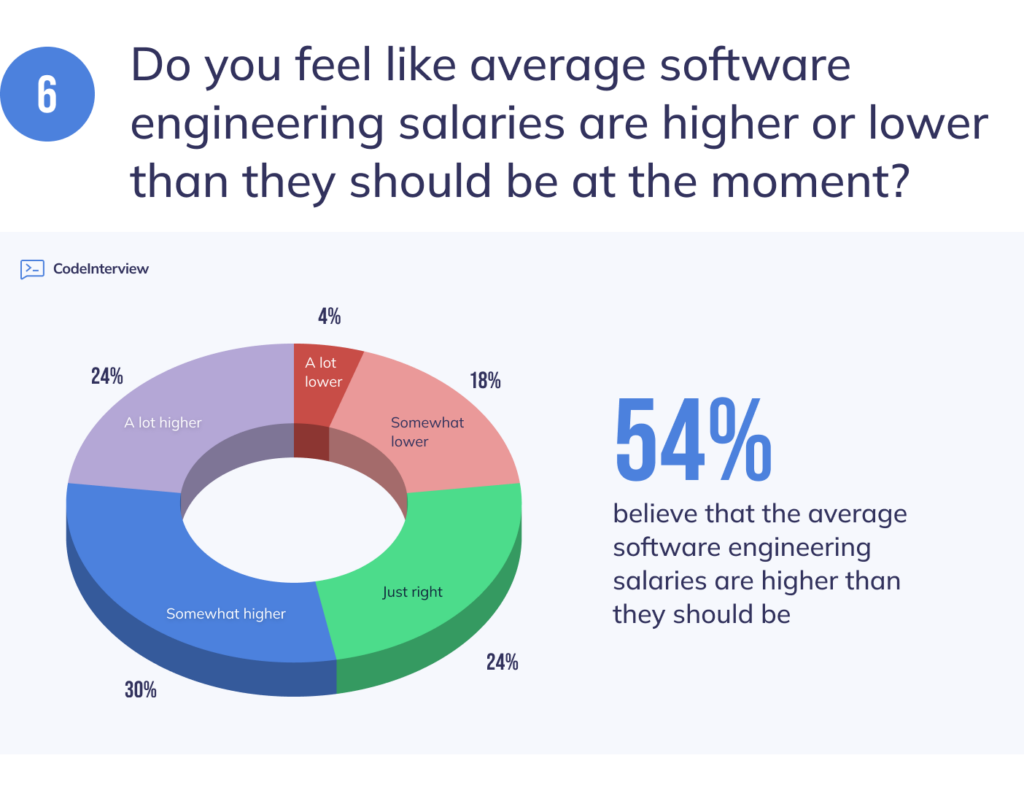
Engineering salaries are higher than they should be
While our survey was focused on software engineers and programmers, more than half of the respondents (54%) believe that the average software engineering salaries are higher than they should be at the moment. This is in line with a related question – 58% of respondents believe that the typical benefits and perks offered to programmers are good enough or more than enough.
Remote work is more important than a 401k scheme for accepting a job offer
While Health insurance was defined as essential for accepting a job offer by 41.5% of respondents, remote work came in second with 37.7% – that’s more than the proportion that requires a 401k pension scheme with 36.8%.
Company-sponsored retreats are seen as least important when deciding whether to accept a programming job offer or not.
Salary negotiations lead to withdrawing from the application process
Almost 72% of our respondents reported a halt to the application process from either side (employer or candidate) due to not agreeing on a salary level.
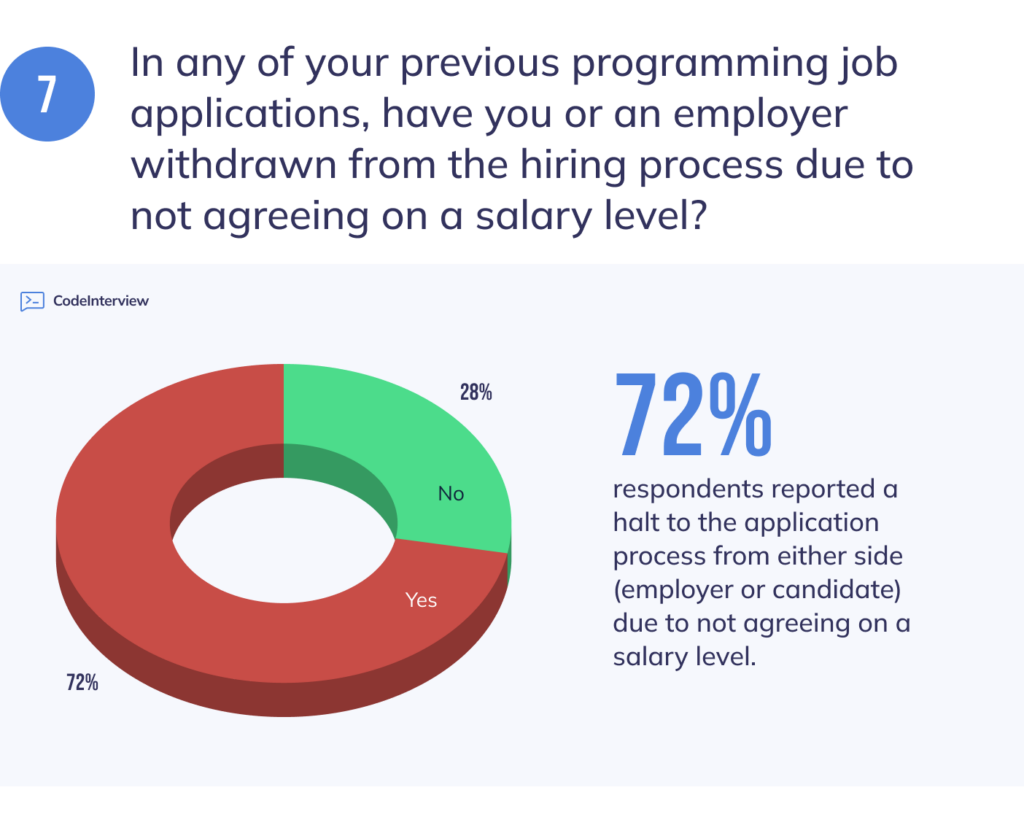
This shows the importance of transparency when it comes to salary ranges. It is both time-consuming for candidates and costly for employers to stop the process at the offer/negotiation stage so communicating this information early on is key.
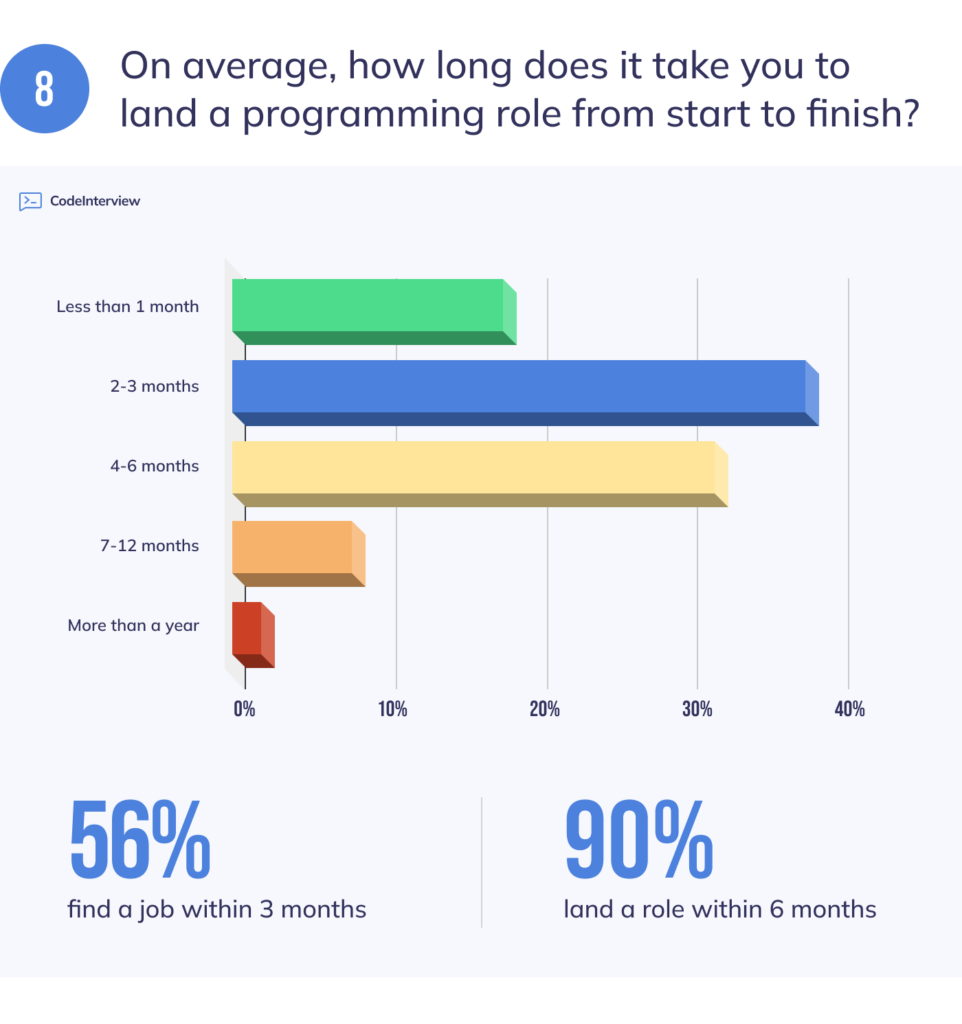
Most programmers land a job within 6 months
The finding that 89.6% of respondents were able to secure a programming job within six months of starting their job search provides valuable insights for technical recruiters. Understanding the timeline in which candidates typically find employment can help recruiters better plan their hiring processes, set realistic expectations, and optimize their recruitment strategies.
Onboarding is typically up to a good level
A full 80% of respondents report their onboarding experience to be Good, Very Good or Excellent when starting a new programming role. The top 3 factors they cite for a successful onboarding are:
- Good documentation
- Quick and easy access to relevant tools and people
- Having enough time to familiarize themselves with the codebase
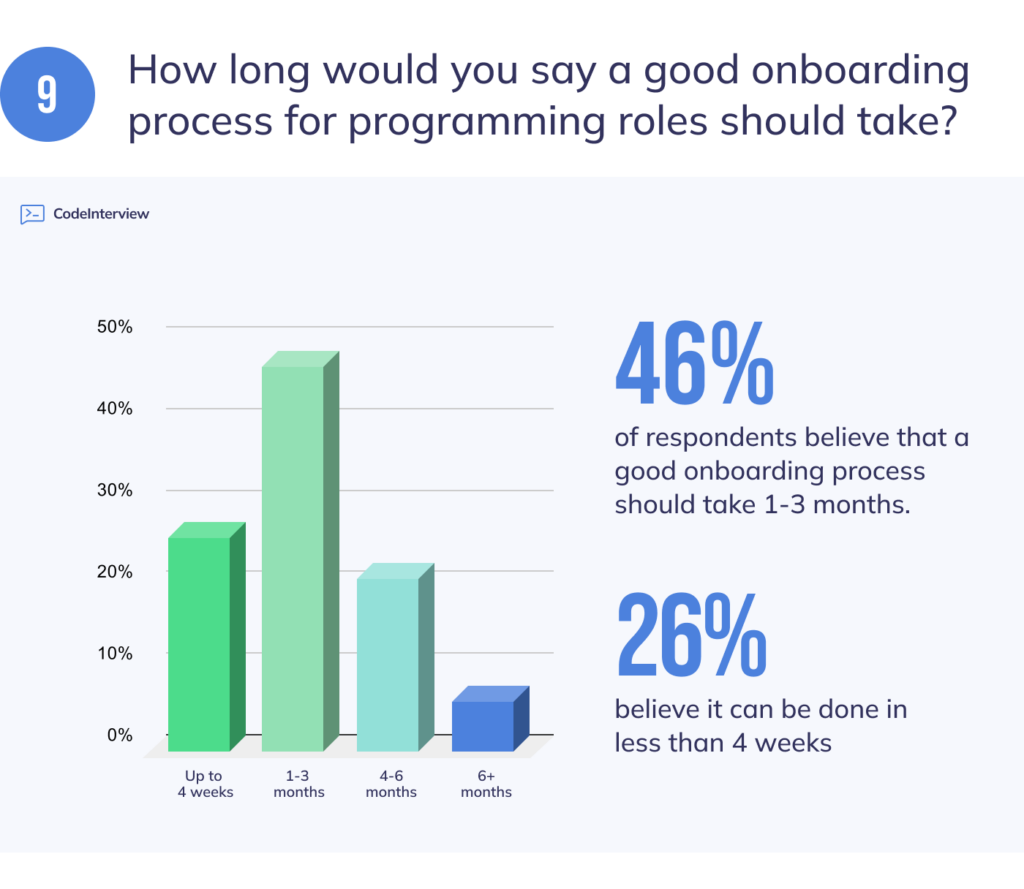
The ideal onboarding process is 1-3 months
46% of respondents believe that a good onboarding process should take 1-3 months. 26.4% of respondents believe it can be done in less than 4 weeks while 20.8% believe 4-6% is best.
Onboarding is key for success in the role
The fact that 84% of respondents consider onboarding as crucial for their future success in the role holds significant implications for technical recruiters. Recognizing the importance of an effective onboarding process can help recruiters optimize their strategies and ensure a smooth transition for new hires, leading to increased productivity, job satisfaction, and retention rates.
Companies get 3 aspects of onboarding wrong
Our respondents cite the following as frequent mistakes by employers in onboarding:
- Having enough time to get familiar with the codebase (60.4% of respondents)
- Good documentation (56.6%)
- Quick and easy access to relevant tools and people (54.7%)
Getting these right is crucial for a good onboarding experience.
Programmers are motivated by money, great managers and co-workers
Salary & perks is the most motivating factor cited by our respondents, with 63.8% ranking this factor as very motivating. The second and third place go to great managers and good co-workers with 59.4% and 54.7% respective.
On the flip side, bad managers and a toxic work environment are most likely to make programmers leave or consider leaving their current role.
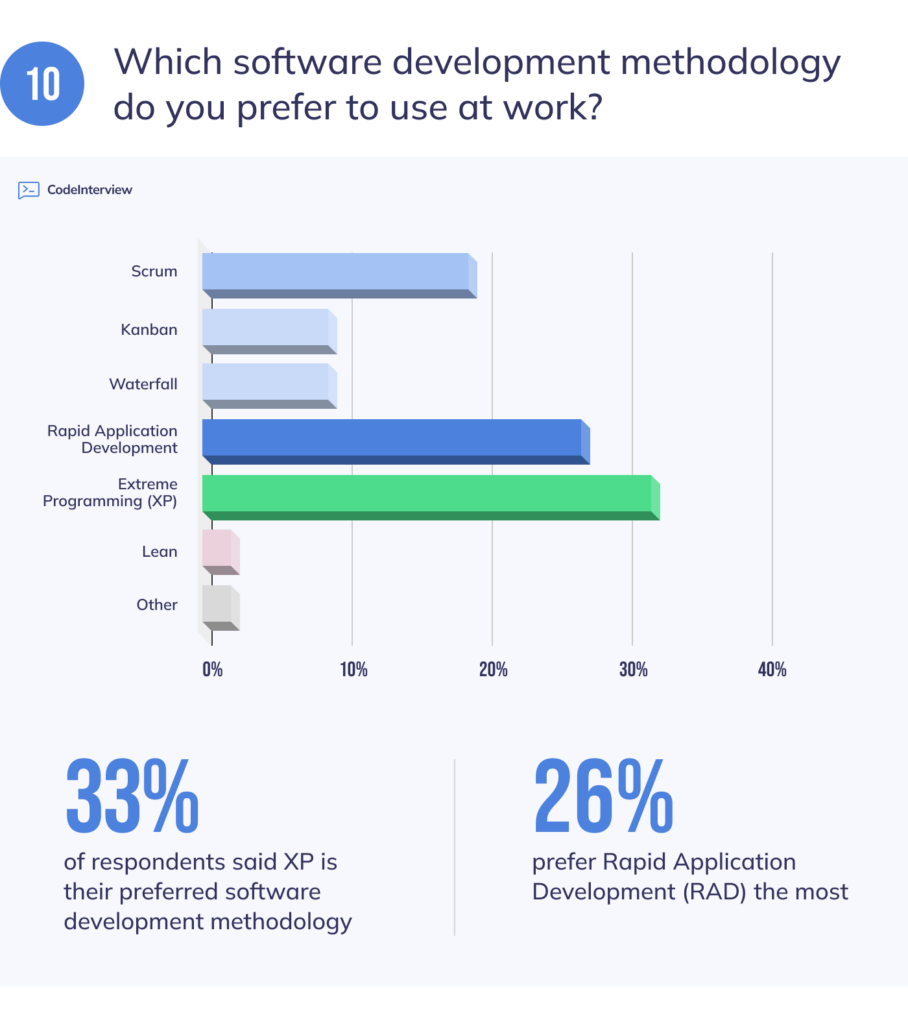
Extreme Programming (XP) is the most preferred software development methodology
33% of respondents said XP is their preferred software development methodology. Rapid Application Development (RAD) came in second with 26.4% and Scrum is third with 18.9%.
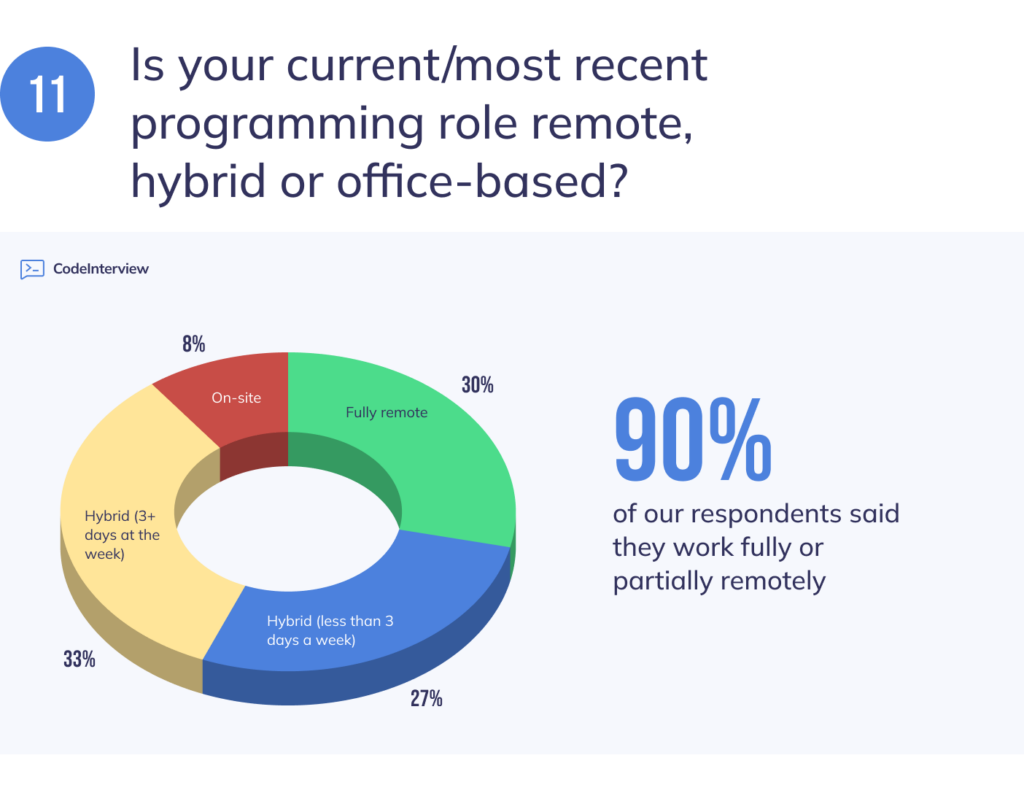
Hybrid is the most popular office setup
Almost 90% of our respondents said they work fully or partially remotely. Only 10.4% work on-site while 28.3% are fully remote. A full 61.3% are currently working in a hybrid arrangement.
Software development teams are typically diverse
Diversity within software engineering teams is a crucial aspect that technical recruiters should prioritize. Our survey results indicate that a significant majority, 63.2% of respondents, reported their teams as either diverse or very diverse, considering factors such as race, gender, and cultural differences. This finding highlights the importance of fostering inclusive and diverse work environments to attract and retain top talent.

Developers believe their salaries will increase
In light of AI developments, we asked if average engineering salaries will increase, decrease or stay roughly the same. The majority (55.7%) believe salaries will increase. A further 24.5% believe they will stay the same, taking inflation into account. 19.8% of respondents believe software engineering salaries will decrease over the next 3-5 years.
AI Assistants are now widely used
The increasing adoption of AI in the daily workflow of engineers is a noteworthy trend, as revealed by our survey. A significant majority, 68% of respondents, reported utilizing AI assistants like GitHub Copilot or Code Interpreter in their day-to-day tasks. This statistic underscores the importance for technical recruiters to recognize the impact of AI assistants on the software engineering landscape and adapt their recruitment strategies accordingly.
Almost everyone is concerned about their career due to AI
In today’s rapidly evolving technological landscape, the impact of AI developments on the careers of software engineers is a significant concern, as highlighted by our survey results. An overwhelming 88.7% of respondents expressed concern regarding the effect of AI on their professional trajectory. Of particular note, 34% of respondents indicated being very concerned about the potential implications.
Most programmers consider switching to AI focus or industry
When asked about the likelihood of switching their career to AI, 65.1% of respondents said they are likely to switch. 7.6% are already in AI while about 10% are unlikely to switch.
In general, the consensus is that AI will be important in the field of software engineering.
Conclusion
Understanding what software engineers value is paramount for recruiters and hiring managers seeking to build high-performing teams. As highlighted throughout this article and our survey, factors such as compensation and benefits, challenging and meaningful work, company culture and team dynamics all play crucial roles in attracting and retaining top software engineering talent.
Ultimately, this proves that attracting and retaining exceptional software engineers requires a comprehensive approach that goes beyond monetary compensation. By investing in the factors that matter most to engineers, organizations can cultivate a workforce that is positioned for success.
Further reading: