
In today’s digital age, data is being generated at an unprecedented rate. From social media interactions to online transactions, every action we take leaves behind a trail of data. However, raw data alone is not enough to provide meaningful insights. This is where data visualization comes into play, transforming complex and vast amounts of information into visual representations that are easily understandable.
Understanding the Basics of Data Visualization
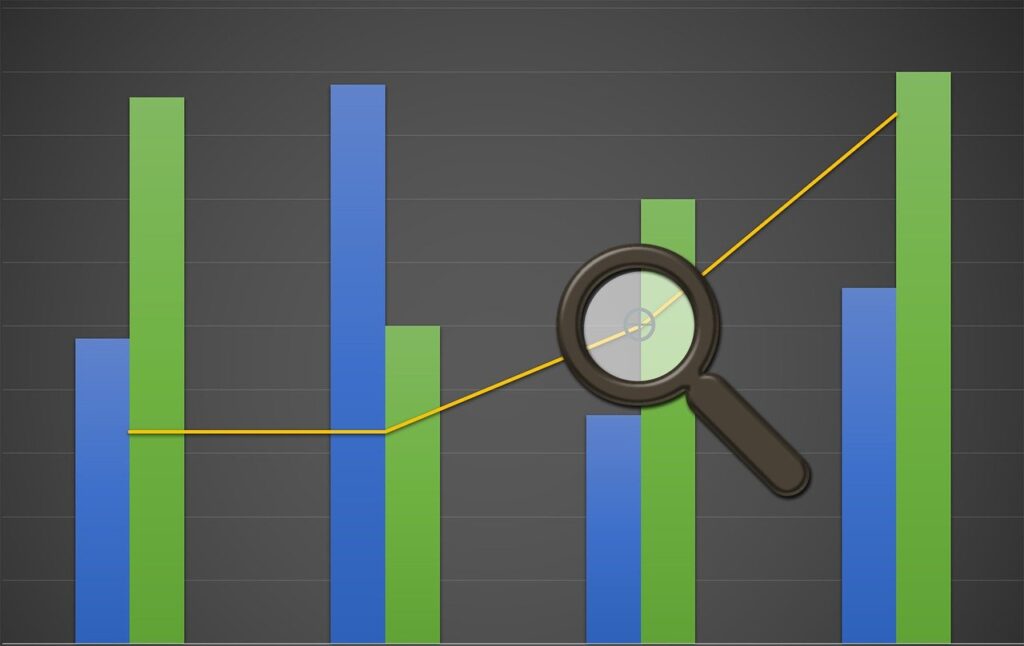
Data visualization refers to the graphical representation of data using visual elements such as charts, graphs, and maps. It employs the use of colors, shapes, and patterns to present data in a visually appealing and intuitive manner. Through the power of visuals, data visualization enables users to comprehend complex information quickly and make data-driven decisions.
Data visualization has become an essential tool in various fields, including business, finance, healthcare, and academia. It allows organizations and individuals to transform raw data into meaningful insights, facilitating better understanding and communication of information. By presenting data visually, it enhances the ability to identify patterns, trends, and correlations that may not be apparent in raw data alone.
Definition and Importance of Data Visualization

Data visualization is not just about creating visually appealing charts and graphs; it is the art and science of visual storytelling. It involves transforming data into impactful visuals that communicate insights, trends, and patterns effectively. By condensing large amounts of data into digestible chunks, data visualization empowers decision-makers to extract valuable insights, identify trends, and detect anomalies, leading to informed choices and strategic actions.
One of the key reasons why data visualization is important is its ability to simplify complex information. Humans are visual creatures, and we process visual information much faster than text or numbers. By presenting data visually, it allows us to grasp the main message and understand the story behind the data more easily. This is particularly crucial when dealing with big data, where the volume and complexity of information can be overwhelming without effective visualization techniques.
Key Components of Data Visualization
Effective data visualization involves several key components. Firstly, it requires the careful selection of appropriate visual elements, such as charts or graphs, based on the type of data being presented. Different types of data require different visual representations to effectively convey the intended message. For example, line charts are commonly used to show trends over time, while bar charts are ideal for comparing different categories of data.
Secondly, data visualization necessitates the use of colors and design principles that enhance clarity and emphasize important patterns or trends. The choice of colors can significantly impact the interpretation of data. Warm colors like red signify high values; cool colors like blue indicate lower values. Design principles guide viewer attention, aid understanding.
Lastly, data visualization should enable interactivity, allowing users to explore the data and gain deeper insights. Interactive features such as tooltips, filters, and drill-down capabilities enable users to interact with the visualizations, uncover hidden details, and answer specific questions. This interactivity enhances engagement and empowers users to explore the data from different angles, leading to more comprehensive and meaningful insights.
In conclusion, data visualization is a powerful tool that transforms complex data into visually appealing and easy-to-understand representations. It enables decision-makers to extract insights, identify patterns, and make data-driven decisions. By understanding the basics of data visualization and its key components, individuals and organizations can effectively communicate data and unlock the full potential of their data-driven endeavors.
The Role of Data Visualization in Business
In the business world, data visualization plays a crucial role in enhancing decision-making processes and simplifying complex data sets.
Fancy way to present data
Data visualization is not just a fancy way to present data; it is a powerful tool that enables businesses to make data-driven decisions by presenting complex information in a visually appealing manner. By removing the burden of deciphering raw data, visualizations allow decision-makers to quickly grasp the significance of the information and take appropriate actions.
Improve decision-making
Imagine a scenario where a company is trying to analyze sales data from different regions. Without data visualization, decision-makers would have to sift through spreadsheets filled with numbers and try to make sense of it all. This process would be time-consuming and prone to errors. However, with data visualization, the same information can be presented in the form of interactive charts and graphs, allowing decision-makers to easily identify trends, patterns, and outliers. This not only saves time but also enhances the accuracy of decision-making.
Simplifies complex datasets
In today’s data-driven business landscape, organizations deal with massive amounts of complex data from multiple sources. Data visualization simplifies these datasets, making it easier to identify patterns, correlations, and outliers. By distilling complex information into intuitive visuals, businesses can gain a comprehensive understanding of their data and identify key insights that inform strategic decision-making.
For example, imagine a retail company that wants to understand the purchasing behavior of its customers. By visualizing customer data, such as demographics, purchase history, and preferences, the company can identify segments of customers that are more likely to make repeat purchases or respond positively to marketing campaigns. This information can then be used to tailor marketing strategies, improve customer satisfaction, and drive revenue growth.
Data visualization also allows businesses to communicate complex ideas and findings to stakeholders more effectively. Instead of presenting a long report filled with technical jargon, visualizations can simplify the message and make it more accessible to a wider audience. This is particularly important when presenting findings to non-technical stakeholders, such as executives or investors, who may not have the time or expertise to delve into the details of the data.

In conclusion, data visualization is a powerful tool that enhances decision-making processes and simplifies complex data sets in the business world. By presenting information in a visually appealing manner, data visualization enables decision-makers to quickly grasp the significance of the data and take appropriate actions. It simplifies complex data sets, allowing businesses to identify patterns, correlations, and outliers more easily. Furthermore, data visualization improves communication by simplifying complex ideas and findings, making them more accessible to a wider audience. As businesses continue to navigate the data-driven landscape, data visualization will play an increasingly important role in driving success and growth.
Types of Data Visualization
Data visualization encompasses various forms, each suited for different purposes and data types. In this section, we will explore some of the most common and versatile forms of data visualization.
Charts and Graphs
Charts and graphs are the backbone of data visualization. They allow for the representation of numerical and categorical data through various chart types, such as bar charts, line graphs, and pie charts. These visualizations provide a concise and organized representation of data, making trends and comparisons easily understandable.
Bar charts are particularly useful for comparing different categories or groups. They use rectangular bars of varying lengths to represent the values of each category, making it easy to identify the highest or lowest values. Line graphs, on the other hand, are excellent for showcasing changes over time. By connecting data points with lines, line graphs illustrate the progression and fluctuations of data over a specific period.
Pie charts, with their circular shape, are ideal for displaying the proportion of different categories within a whole. The size of each slice represents the relative magnitude of each category, allowing viewers to quickly grasp the distribution of data.
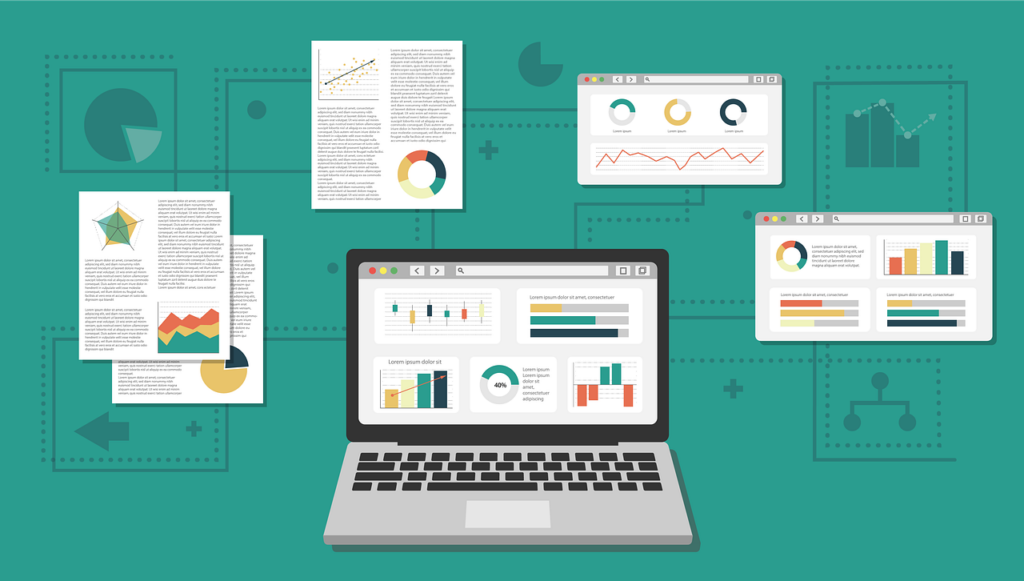
Infographics and Dashboards
Dashboards and infographics provide a holistic view of complex data by combining multiple visual elements. Infographics are visual representations that incorporate text, images, and charts to convey information in a visually appealing and engaging manner. They are often used to present data in a way that is easy to understand and remember.
Dashboards, on the other hand, are interactive visual displays that aggregate and present real-time data from various sources. They are commonly used in business settings to monitor key performance indicators (KPIs) and track progress towards goals. Dashboards allow users to explore data in a structured and engaging manner, enabling them to extract actionable insights promptly.
With the advancement of technology, interactive dashboards have become increasingly popular. Dashboards let users interact, drill down, and customize views. Real-time updates empower quick, data-driven decisions.
Charts simplify information, highlight patterns, and aid decision-making. Data visualization transforms raw data into meaningful insights.
The Process of Data Visualization
Data visualization involves a step-by-step process that begins with data collection and ends with the creation of visual representations.
Data visualization is a powerful technique that allows us to explore and understand complex datasets. By transforming raw data into visual representations, we can uncover patterns, trends, and insights that might otherwise be hidden. In this expanded version, we will delve deeper into each step of the data visualization process.
Data Collection and Cleaning
The first step in data visualization is collecting the relevant data. This can involve extracting data from various sources such as databases, spreadsheets, or web APIs. Data can come in different formats, such as CSV, JSON, or XML, and may require different methods of extraction.
Once the data is collected, it needs to be cleaned and prepared for visualization. This includes removing duplicates, handling missing values, and formatting data into a suitable structure. Data cleaning is a crucial step because visualizations are only as good as the data they are based on. By ensuring data quality, we can trust the insights derived from our visualizations.
During the cleaning process, we may also need to perform data transformations or calculations to derive new variables that are more meaningful for visualization. For example, we might calculate percentages, averages, or rates of change to provide additional context to our visualizations.

Choosing the Right Visualization Tool
After cleaning the data, the next step is selecting the appropriate visualization tool. Numerous tools, both free and paid, are available to suit different needs and skill levels. From simple spreadsheet software with built-in charts to specialized data visualization software, there is a wide range of options.
The choice of tool depends on factors such as data complexity, visualization requirements, interactivity, and desired output formats. Some tools are better suited for exploratory data analysis, allowing us to quickly generate a variety of visualizations to gain insights. Others are more focused on creating polished, publication-ready visualizations with advanced customization options.
When selecting a visualization tool, it’s important to consider the learning curve and the availability of resources and support. Some tools have a steep learning curve and require programming skills, while others have a user-friendly interface that allows for drag-and-drop functionality.
Additionally, it’s worth exploring the different types of visualizations that can be created with each tool. Bar charts, line charts, scatter plots, heatmaps, and network diagrams are just a few examples of the wide range of visualizations available. Choosing the right visualization type can greatly enhance the effectiveness of communicating insights from the data.
Data Exploration and Visualization
Once the data is cleaned and the visualization tool is selected, we can begin the process of exploring the data and creating visual representations. This involves selecting the appropriate visualization types that best represent the patterns and relationships in the data.
During the exploration phase, we can generate multiple visualizations to gain different perspectives on the data. This iterative process allows us to refine our understanding of the dataset and uncover new insights. We can experiment with different visual encodings, such as color, size, and shape, to highlight different aspects of the data.
As we create visualizations, it’s important to consider the audience and the intended message. The choice of colors, labels, and annotations can greatly impact how the visualizations are perceived and understood. We should strive for clarity and simplicity, avoiding clutter and unnecessary complexity.
Interactivity is another important aspect of data visualization. By adding interactive elements, such as tooltips, filters, and zooming capabilities, we can empower users to explore the data in a more engaging and meaningful way. Interactive visualizations allow users to drill down into the details, filter out noise, and discover their own insights.
In conclusion, the process of data visualization involves collecting and cleaning the data, choosing the right visualization tool, and exploring the data through visual representations. Each step is crucial in transforming raw data into meaningful insights that can drive decision-making and improve understanding. By following this process, we can unlock the full potential of our data and communicate complex information in a clear and compelling way.
Challenges in Data Visualization
While data visualization offers immense benefits, it also presents a set of challenges that need to be addressed. In order to fully harness the power of data visualization, it is crucial to overcome these challenges and create meaningful and impactful visual representations.
Dealing with Large Data Sets
The exponential growth of data poses challenges in processing and visualizing large datasets. As the volume of data increases, it becomes increasingly difficult to effectively convey the information in a visually appealing and comprehensible manner. Visualizations that are overloaded with information can lead to clutter and confusion, defeating the purpose of data visualization.
One technique to address this challenge is aggregation, which involves summarizing large datasets into smaller, more manageable subsets. By condensing the data, it becomes easier to identify patterns and trends without overwhelming the viewer. Another approach is filtering, where specific criteria are applied to narrow down the dataset, focusing on the most relevant information. Additionally, sampling can be employed to select a representative subset of data points, allowing for a more concise and concise visualization.
Ensuring Data Accuracy and Consistency
Data visualization relies heavily on accurate and consistent data. Inaccurate or inconsistent data can lead to incorrect conclusions and subsequent flawed decision-making. Therefore, it is essential to verify the integrity of the data and ensure that it is up to date, reliable, and aligned with the intended visuals.
One way to address this challenge is through data validation and cleansing. This involves thoroughly examining the data for errors, inconsistencies, and outliers. By identifying and rectifying these issues, the accuracy and reliability of the data can be improved. Additionally, establishing data governance practices and implementing data quality controls can help maintain consistency and integrity throughout the visualization process.
Furthermore, it is important to consider the source of the data and its potential biases. Understanding the context and limitations of the data can help mitigate any potential inaccuracies or misinterpretations. Collaborating with domain experts and subject matter specialists can provide valuable insights and ensure that the data used for visualization is accurate and reliable.
In conclusion, while data visualization offers numerous advantages, it is not without its challenges. Dealing with large datasets and ensuring data accuracy and consistency are two key obstacles that need to be overcome. By employing techniques such as aggregation, filtering, and sampling, and implementing data validation and cleansing processes, these challenges can be addressed, resulting in more effective and impactful data visualizations.
The Future of Data Visualization
Data visualization is continually evolving, influenced by advancements in technology and emerging trends.

Emerging Trends in Data Visualization
One of the emerging trends in data visualization is the incorporation of virtual reality (VR) and augmented reality (AR) technologies. These technologies allow users to immerse themselves in data environments and explore visualizations in a more interactive and immersive way. Additionally, the use of storytelling techniques and narrative-driven visualizations is gaining popularity, as it helps users connect with data on a deeper, more emotional level.
The Impact of AI and Machine Learning on Data Visualization
Artificial intelligence (AI) and machine learning (ML) are revolutionizing data visualization. These technologies enable the automation of data analysis, pattern recognition, and recommendation systems. They are making it easier to create visualizations and uncover hidden insights. AI-powered tools can not only generate visualizations automatically but also provide intelligent data exploration capabilities, assisting decision-makers in understanding complex datasets more effectively.
In conclusion, data visualization is a powerful tool that enables businesses to derive meaningful insights from large and complex datasets. Data visualization transforms raw data into intuitive representations. Empowers decision-makers for informed choices and successful outcomes. Advancing technology enhances visualization, offering innovative ways to explore and communicate data.